Performance tools
1 Server processing overview
2 Options Window
2.1 Options in the Swing framework
2.2 Options in the JavaFX framework
2.2.1 Charts presentation options
3 Global monitoring informations
4 Detailed JavaFX informations
5 JavaFX charts
6 Further informations
6.1 Logging and debugging
6.2 Java Console Troubleshooting
7 Notes
8 See also
It is possible to monitor various informations about the Server performance in the Server console Window.


The Swing options allows to:

The JavaFX options allows to:
In JavaFX:
The following performance informations are presented:
Depending on the presentation options, the following charts can be presented:
Server processing overview
The ARINC 661 Server runtime pipeline is event-driven, which means that its job is to:- Interpret pilot actions and send the associated events to the UA
- Decode UA messages and update the display
- Decode the Buffer in the Buffer reception Thread for the Channel associated with the Buffer
- Start an updating Task in the UI framework Thread
- Update the graphics in the UI framework Thread
×
![]()
The overall computing time is the sum of:- The Decoding time: the time to decode the Buffer
- The Invoking time: the time to start the updating Task the UI framework Thread
- The Updating time: the time to update the graphics
Options Window
Options in the Swing framework
The options Window can be shown with the following command in the Menu: Tools => Performance Options.
The Swing options allows to:
- Select the Channel for which we want to see the monitoring informations. Note that if here is only one Channel (which is always the case if no Network Configuration has been defined), the associated comboBox is greyed out
- Specify if only general or detailed informations should be presented
Options in the JavaFX framework
The options Window can be shown with the following command in the Menu: Tools => Performance Options.
The JavaFX options allows to:
- Select the Channel for which we want to see the monitoring informations. Note that if here is only one Channel (which is always the case if no Network Configuration has been defined), the associated comboBox is greyed out
- Specify if only general or detailed informations should be presented
- Specify the frequency for which the informations should be computed (the default is every second). Note that it does specify the frequency on which the mean of the informations will be computed every, but it does not omit any buffer reception or processing
- Specify which charts will be presented in the monitoring informations charts presentation (see Charts presentation options)
Charts presentation options
The available charts that can be presented for the JavaFX performance monitoring are:- JavaFX pulse in Frames per second
- Total Processing time
- Used memory
- Buffer size
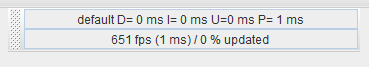
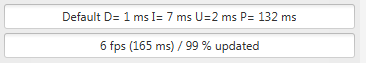
Global monitoring informations
The global performance informations present in the Server console:- The selected Channel
- "D": the Decoding time mean in ms
- "I": the Invoking time mean in ms
- "U": the Updating time mean in ms
- "P": the overall processing time mean in ms
- The Frames per seconds means
- The percentage of updated Buffers compared to the number of Buffers received by the Server[1]
Having a low value for this parameter means that the Server has difficulties to follow the User Application Buffer sending rate
In JavaFX:
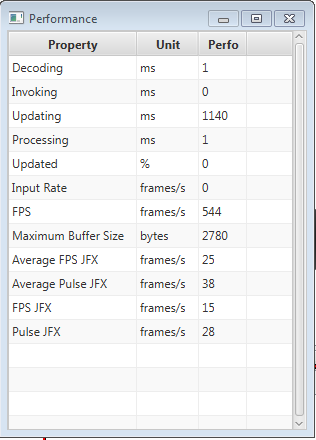
Detailed JavaFX informations
The detailed JavaFX monitoring informations Windows can be shown with the following command in the Menu: Tools => Show Performance Details.
The following performance informations are presented:
- Decoding: the Decoding time mean in ms
- Invoking: the Invoking time mean in ms
- Updating: the Updating time mean in ms
- Processing: the overall processing time mean in ms
- Updated: the percentage of Buffers which have been updated[1]
Having a low value for this parameter means that the Server has difficulties to follow the User Application Buffer sending rate
- Input Rate: the rate of the Input Buffer in frames per second
- Input Rate: the rate of the Input Buffer in frames per second
- FPS: the Frames per seconds means
- Maximum Buffer Size: the maicumum size of the input buffer
- FPS JFX
- Pulse JFX
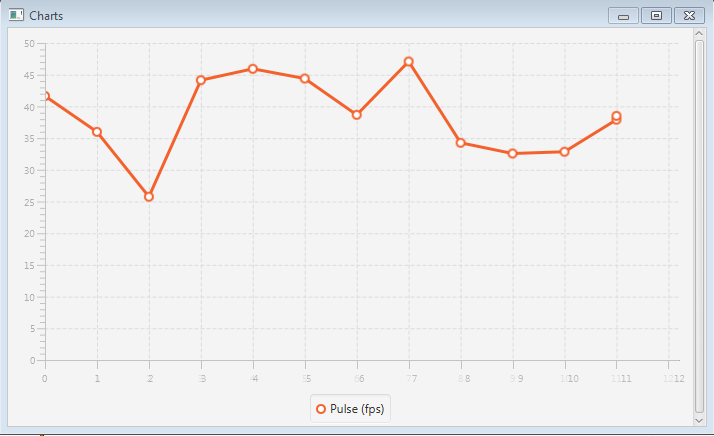
JavaFX charts
The JavaFX performance charts Windows can be shown with the following command in the Menu: Tools => Show Charts.
Depending on the presentation options, the following charts can be presented:
- JavaFX pulse in Frames per second
- Total Processing time
- Used memory
- Buffer size
Further informations
Logging and debugging
A ways to see if the Server receives too many Buffers and can't handle them all is to look the percentage of input Buffers which are skipped. This can be seen by looking at the global performance informations, or by setting the eventQueue.showSkippedEvents property.Java Console Troubleshooting
It is possible to attach a Java console to the Server process, which shows various informations about the memory usage. This also allows to dump the content of the memory at any time. The JVM options are:-Dcom.sun.management.jmxremote=true -Dcom.sun.management.jmxremote.authenticate=false -Dcom.sun.management.jmxremote.ssl=false -Dcom.sun.management.jmxremote.local.only=false -Dcom.sun.management.jmxremote.port=9012 -Dcom.sun.management.jmxremote.hostname=127.0.0.1
Notes
See also
- Performance considerations: This article deals about performance considerations for the Server
×
![]()
Categories: dev | performance | server | user